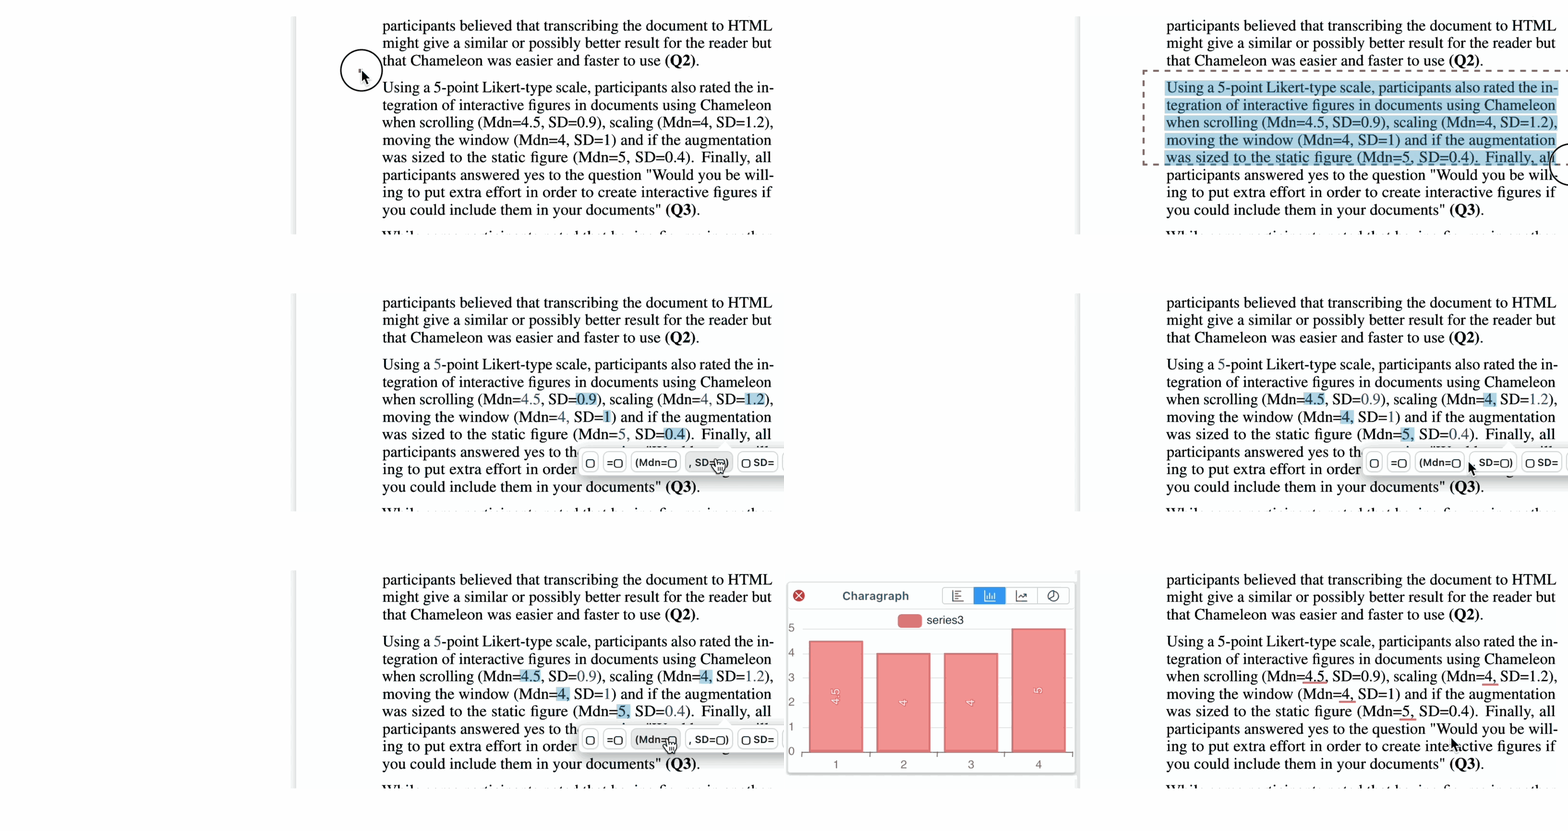
After selecting a paragraph of text, a popup menu lets you choose different group of values that can be turned into a chart.
In-text numbers can be hovered over to view the corresponding values in the chart
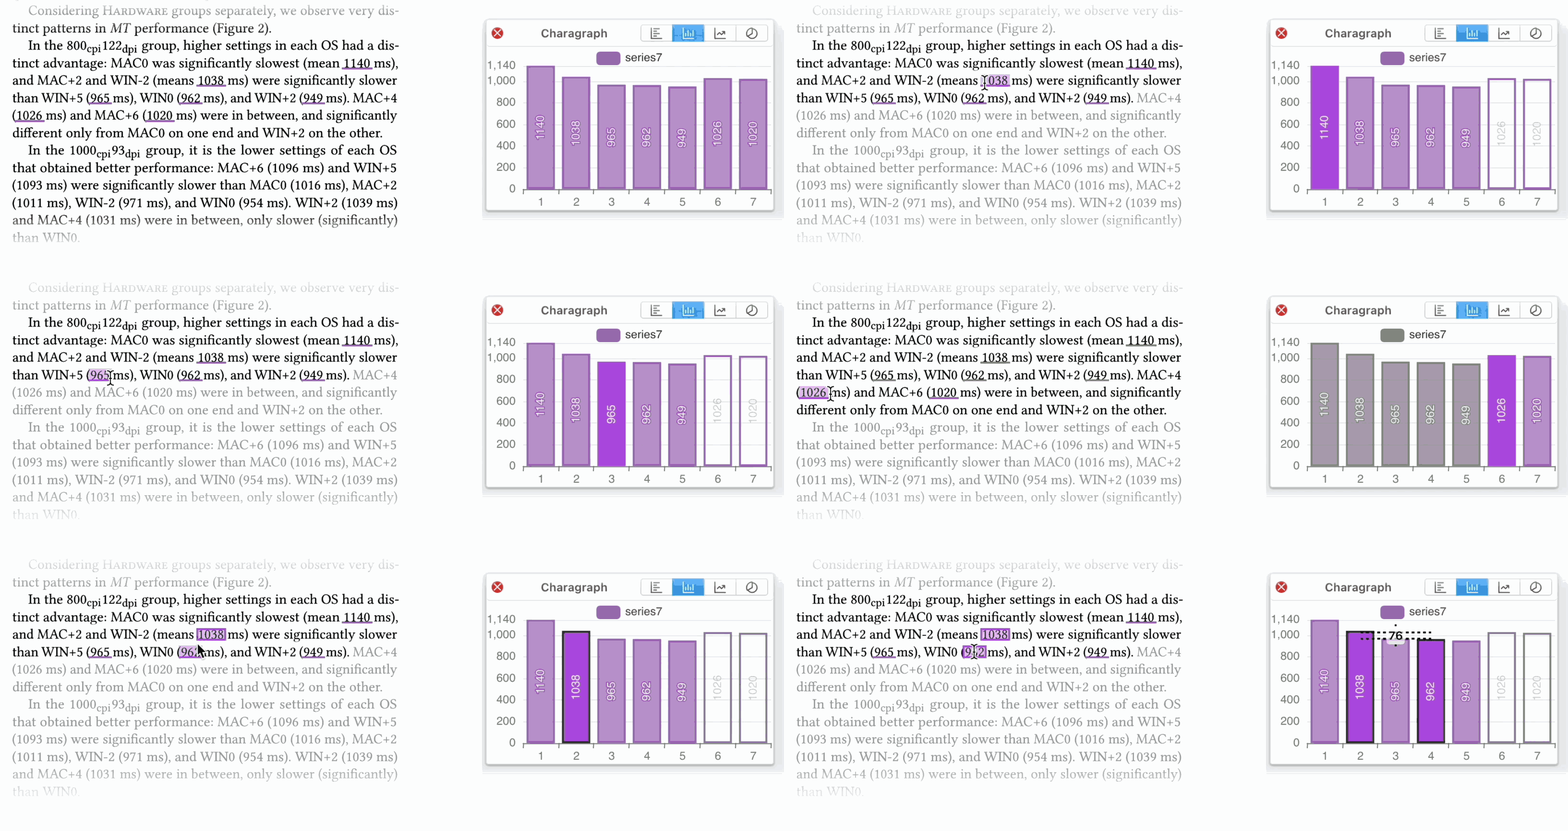
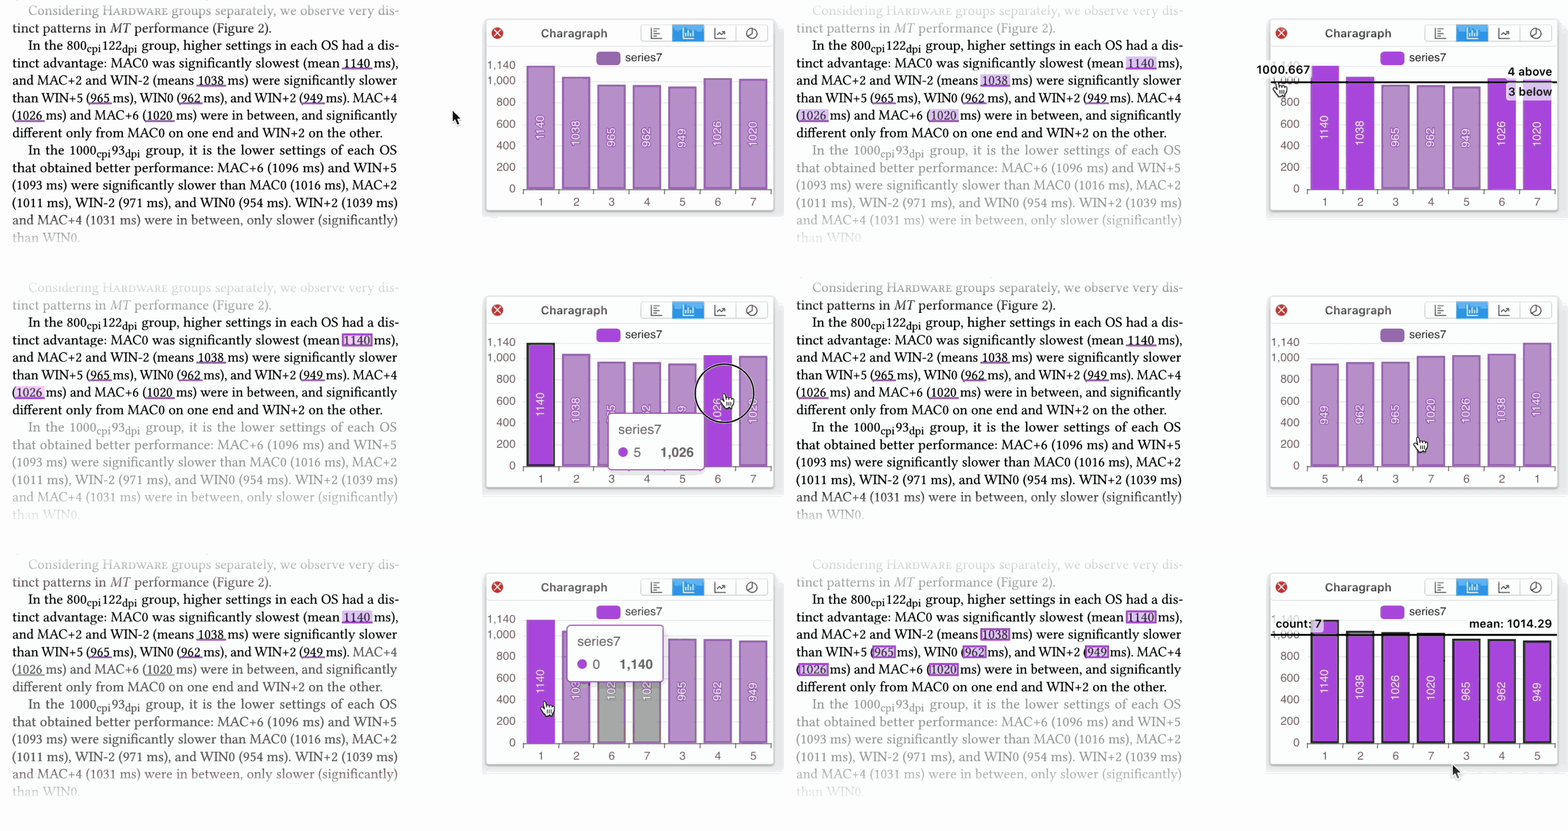
The chart supports common data exploration tasks such as filtering, comparing, sorting, and calculating means.
Labels can be added and the chart can be changed to a bar, line or pie chart.
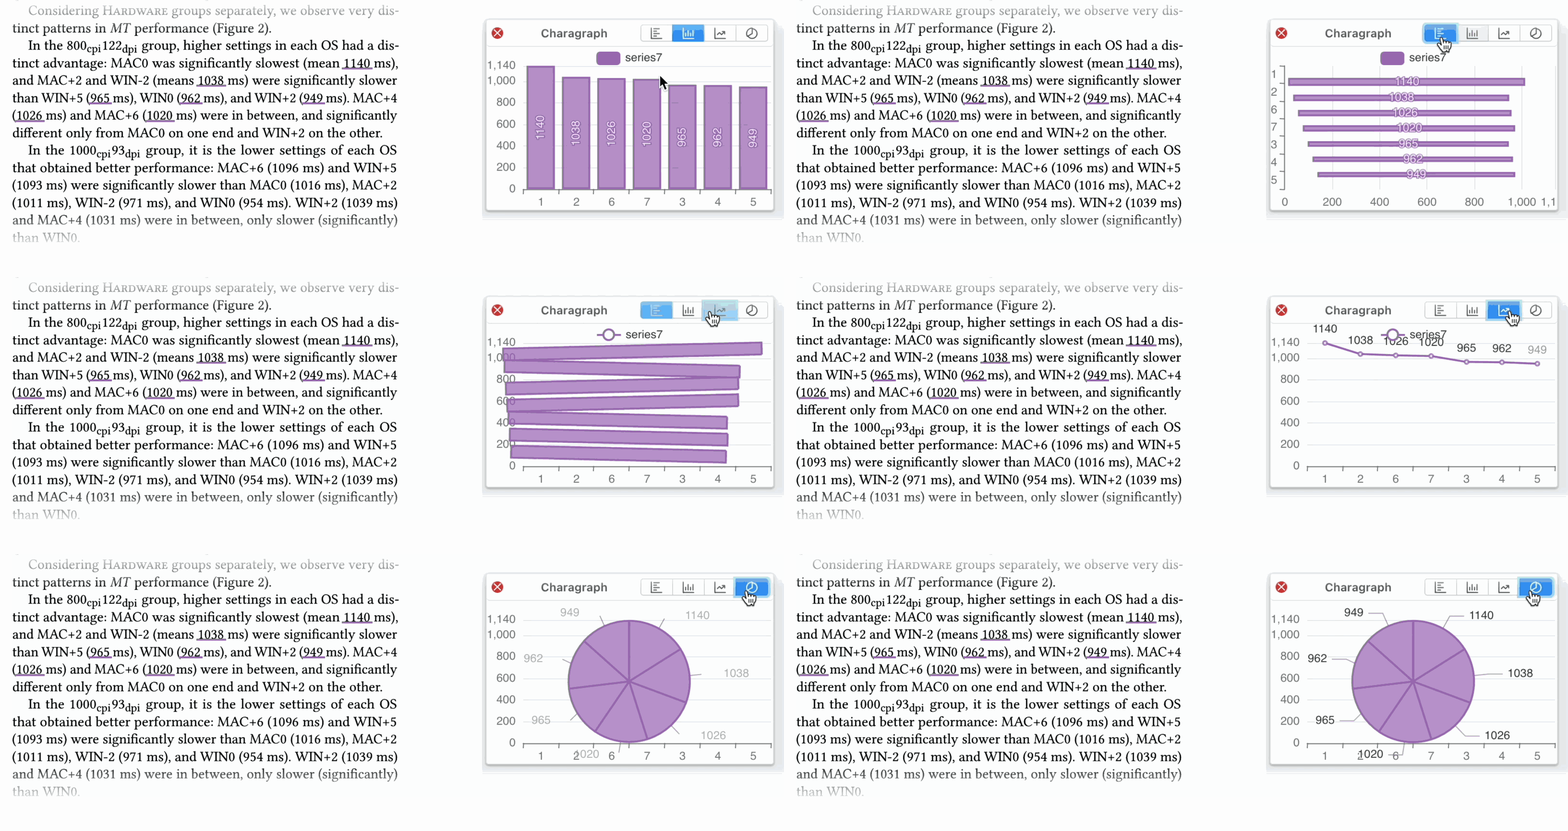
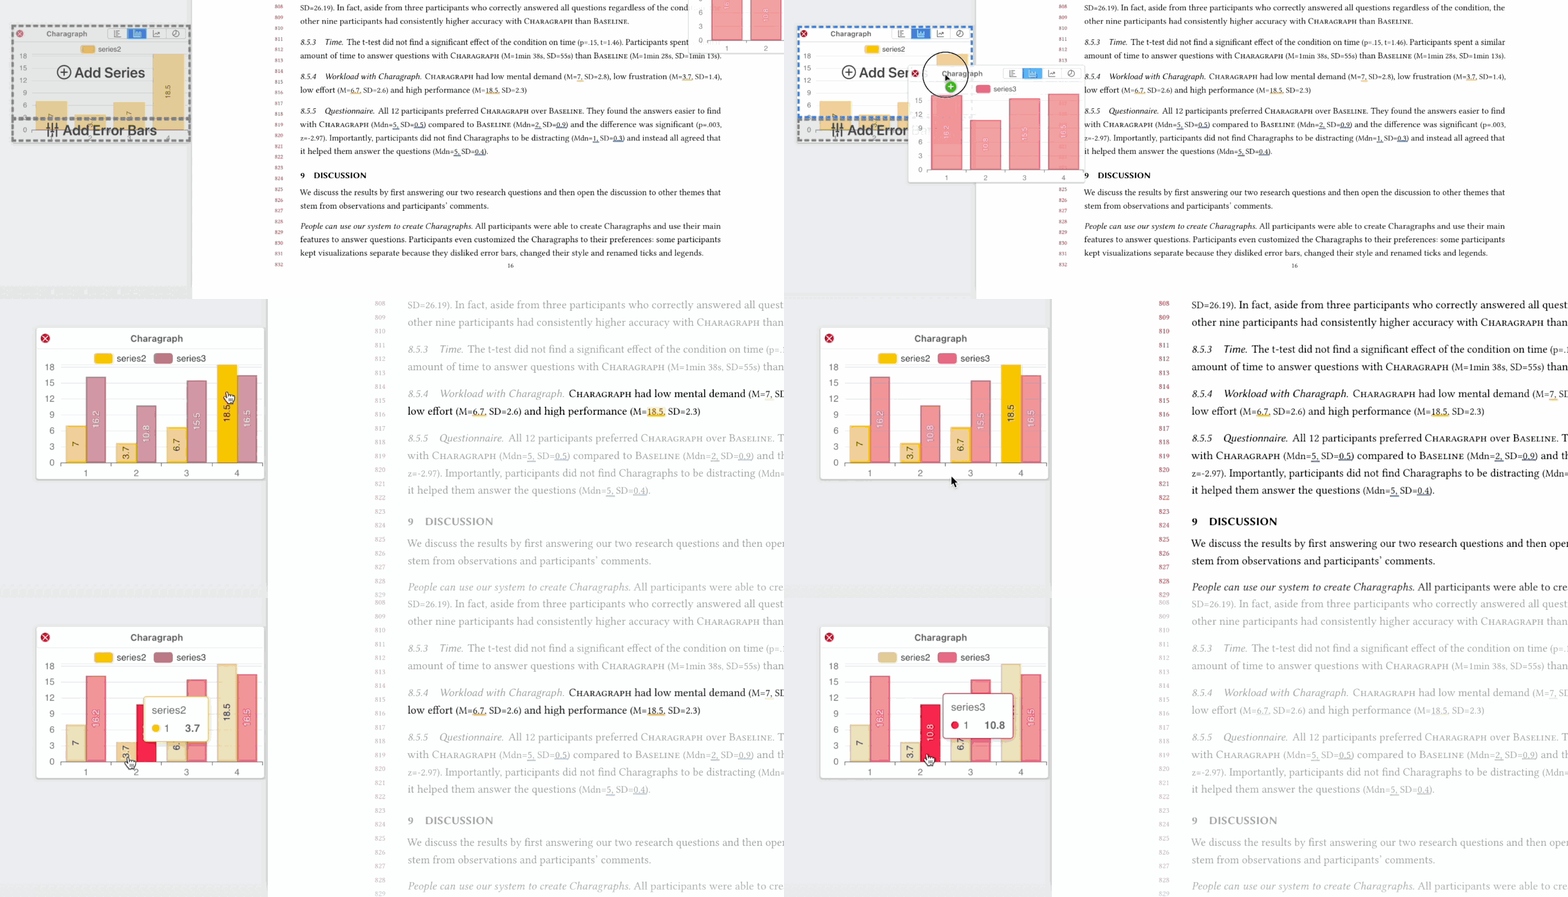
Two Charagraphs can be combined to show data scattered in the document or show error bars.
Damien Masson, Sylvain Malacria, Géry Casiez, and Daniel Vogel. 2023. Charagraph: Interactive Generation of Charts for Realtime Annotation of Data-Rich Paragraphs. In Proceedings of the 2023 CHI Conference on Human Factors in Computing Systems (CHI '23). Association for Computing Machinery, New York, NY, USA, Article 146, 1–18. https://doi.org/10.1145/3544548.3581091